Resolving Embedded Files at Runtime via strace
Jared Stroud
Cloud Security Researcher, Lacework Labs
Modern Linux malware binaries are being shipped with one or more embedded files. Often, the first stage binary is simply a dropper for the real payload. Prior to the “real payload” being dropped, it’s common to see checks for the host’s CPU architecture, Linux distribution or a series of other factors that influence which embedded payload is used on the victim host. When you add in the complexities of obfuscation, encryption and decompilation of modern languages (Golang/Rust), identifying said embedded resources and manually extracting them through static reversing engineering techniques is often quite the time sink.
A quick way to obtain these resources, when dynamic execution is an option, is to leverage strace. According to the strace project website, strace is a “diagnostic, debugging and instructional user space utility for Linux”. While strace can be incredibly helpful for debugging a misbehaving application, it’s also an extremely powerful reverse engineering utility. For example, by identifying underlying files being written to disk via the write, pwrite, and fwrite syscalls it’s easier to identify and obtain files of interest rather than manually carving out bytes. Those familiar with strace and Linux may also be familiar with ptrace. The ptrace system call allows for process introspection. The strace utility leverages the ptrace system calls to give the end user insight into what a process is doing.Those coming from a Windows environment can think of strace as the Linux counterpart to procmon.
Filtering on specific syscalls, and following forking processes can lead the end-user to a deeper understanding of what exactly the binary is doing. Let’s explore how the Lacework Labs team leverages strace in some situations to perform analysis on malicious Linux binaries.
Logging All Syscall Data
Prior to filtering out valuable data from strace, it can be useful to capture all output to gain an understanding of binary execution and then trim out erroneous data as appropriate. By default, strace will log all data to stdout. Using the -o command line option along with the follow fork (-ff) options, a new strace file will be created for every process that executes fork, vfork or clone system calls. By executing our test application below with strace command line options discussed previously, a new log file per process is generated with a process id being appended to the file name.
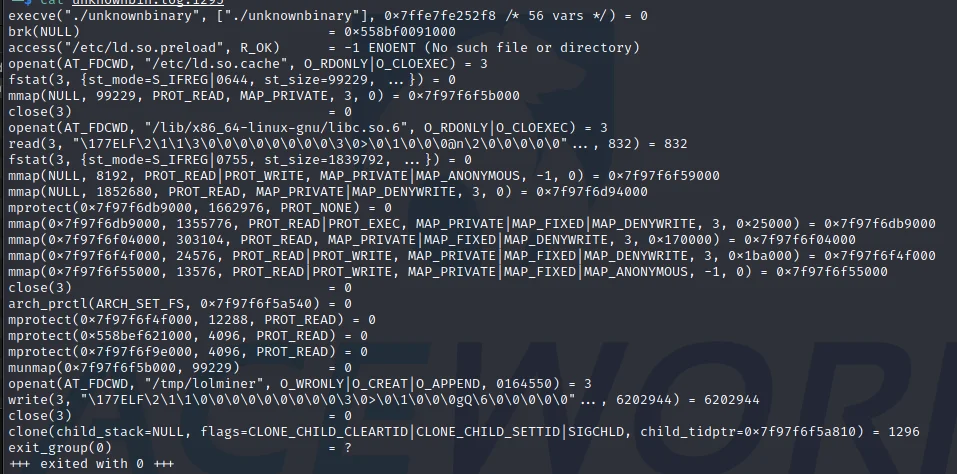
Examining the first log file (unknownbin.log.1251) a verbose amount of information pertaining to syscalls executed is displayed.It’s important to remember that everything is a file on linux, the same system calls used to read and write local files can also be leveraged for network connectivity. It’s expected that several variations of reads, opens, writes, closes and memory allocation calls will be observed.
Digging through the data displayed in the image above and narrowing in on the write syscalls, it’s apparent that a file is created at location “/tmp/lolminer,” and that an ELF file (as indicative of the magic bytes) is being written to this location.
The first argument within the write function is a file descriptor. This file descriptor pertains to the previous function call above (open) which returned the integer value of 3. In especially busy applications, it can be hard to keep track of who’s opening what where. Luckily strace has a flag for that! By re-executing our strace command with the addition of the -y flag, we can have the file path replace the file descriptor. An example of this is shown below.
The value “6202944” represents the number of bytes written to disk. This can be used as a quick sanity check to ensure that the file on disk is the same number of bytes that strace is reporting as written. In the event these numbers are different something occurred during the writing of the file that interrupted said writing of data. Perhaps the file descriptor was suddenly closed or the executable crashed during execution. A quick execution of stat against the binary confirms that the bytes have all been written to disk.
Immediately after closing the file, the clone syscall is executed to create a child process. Per the strace documentation, this is a point that a new process log file would be created. Examining the second process log file (unknownbin.log.1252), the execve syscall is leveraged to execute “/bin/bash -c /tmp/lolminer”.
Breaking strace logs out into per-process log files helps paint the picture of execution and allows for easier filtering by understanding which process executed what syscalls. However, the log files shown in this simple example are still fairly verbose. After a situational understanding of what the binary is doing is understood, further syscall filtering can occur to obtain the signal from the noise.
Filtering for Syscalls of Interest
Strace’s command line option “-e” allows the end-user to specify which system calls to filter on. From the previous paragraph there are two syscalls (write, execve) that are particularly interesting for this contrived example. Re-executing the example code above with the addition of command line options “-e write,execve” results in just the syscalls that are interesting to us.
At this point, an end user can go forth and start diving into these files and understanding what exactly they’re doing on their Linux systems, and hopefully provide some context to how it got there in the first place!
Attaching to Already Running Processes
In the scenario of an odd process running in a cloud environment and further insight into what the process is required, it’s possible to attach to the running processes via strace. The -P command line argument allows you to specify a process to attach to. It’s important to note that prior to executing this command on a production system, ensure that your team’s incident response practices are being followed or you may run the risk of losing valuable forensic evidence if the process crashes.
The image below shows strace attaching to the pid (3337) of “unknownbinary” and a connection being made to an IPv4 address of 169.254.169.254 on port 80. Cloud providers such as AWS leverage this IP address for metadata services (T1552.005). Often, attacker query this address followed by a specific API endpoint to obtain cloud environment credentials or access tokens.
This is just a small glimpse into what strace can offer from a reverse engineering perspective. It’s important to note that some malware variants may detect the underlying ptrace system calls, and change behavior. That being said, it’s still a powerful utility to have in your tool kit and can be useful when hunting for files being written to the system. If you’re interested in Cloud security and Linux research, please follow the @LaceworkLabs Twitter to keep up with our latest research.
Categories
Suggested for you


